Overview
Most LBO models assume a ‘private exit’ – which reflects a sale of the company to another buyer after an investment hold period of ~5 years. Private exits reflect a 100% sale and transfer of ownership on the exit date.
Some businesses are so large that a private sale may not be a likely exit scenario – or even if it is, understanding and comparing/contrasting a private sale to an IPO Exit may be a worthwhile exercise.
Unlike a private sale, IPO Exits can take several years for the sponsor to fully exit the investment (i.e., sell their last share in the company). The first shares are sold at the IPO date, but the remaining shares are sold over a “sell-down period” which could be several years post IPO (typically 2-4 years).
Pros of IPO
Valuation. Public markets investors in theory have a lower cost of capital (~6-12%) than PE firms (~20%), so should be able to place a higher valuation on companies relative to a sale to a PE firm.
Size Accommodation. IPO markets can accommodate very large ($10bn+) companies whereas fewer private markets buyers would be available at that size bracket.
Cons of IPO
Fees & Discounts. Investors in IPO shares expect to buy at a “discount” to the fair market value of shares offered at IPO. This discount is typically 10-15% of the fair market value of the shares at the time of IPO, which is meaningful. In addition to the discount, fees paid to the underwriting banks that are coordinating the IPO are also significant (5-7%+).
Time to Exit. PE deals that end up in an IPO Exit typically take longer to fully monetize than private exit scenarios. This is because it usually takes a few years to prepare the company for IPO, then could take 3-4 years to sell down all the shares held by the PE firm. All things being equal, longer hold periods have negative impact on IRR.
Market Volatility. Being publicly listed puts the company’s valuation in the hands of public investors. While the valuation at time of IPO may be attractive to the PE sponsor, there is no guarantee that subsequent sell-down opportunities will be at the same or higher valuations unless the company continues to meet or exceed earnings guidance / targets.
Modeling an IPO Exit
The following paragraphs provide a framework for how to model an IPO Exit from first principles, as well as a discussion on the rationale for each step. Follow these steps to build an IPO Exit outside of Mosaic (i.e., in Excel). For an Excel copy of the below analysis, reach out to your Mosaic Account Executive or sales@mosaic.pe.
A digital IPO Exit module is available in Mosaic under “Special Situations” to save you from needing to repeat these steps and reduce manual error. See our help article below on how to add an IPO exit to your Mosaic model:
Mosaic Special Situations | IPO Exit
Desired Goal
Modeling an IPO Exit at a minimum must produce an IRR and MOIC that are comparable to the “Private Exit” returns metrics included in most standard LBOs. We will be working towards building an IPO Exit and Returns schedule like the below via a series of supporting schedules to calculate each subcomponent:

Step 0 – IPO Assumptions
As with any deal modeling exercise, it’s helpful to start by setting up an assumptions bank that clearly separates your chosen inputs from the mechanics of the model itself. The key assumptions you need to make space for before building anything are:
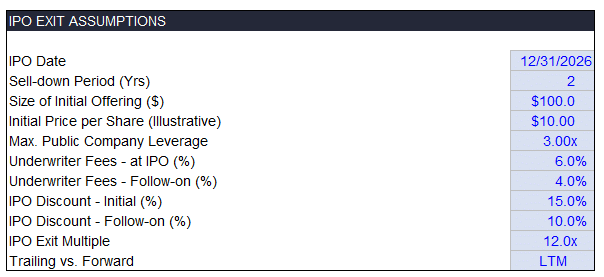
IPO Date
Sell-Down Period
Size of Initial Offering
Initial Price per Share
Maximum Leverage at IPO
IPO Discount (one assumption for discount at IPO and one for follow-on offerings post IPO)
IPO Underwriter Fees (one assumption for fees at IPO and one for follow-on offerings post IPO)
Exit Multiple
Whether the Exit Multiple is Trailing (LTM) or Forward (NTM)
Here’s an example of what the IPO Exit Assumptions bank looks like in Mosaic:
Here’s a quick refresher on each concept:
IPO Date. Select a date in the forecast period when you will sell the first shares to public investors. We’ll call this the IPO date. Most sponsors will assume they will IPO in year 3 or 4 of their investment period, to give the company time to (a) continue to grow and show historical growth rates necessary for a successful IPO, and (b) produce enough history of high-quality financial statements under the sponsor’s management to be able to file an S1 (the IPO registration document filed with the SEC).
Sell-Down Period. Select a period of time – stated in number of years – that it will take to sell all of the sponsors shares to public investors. Firms typically assume it will take 2-4 years to sell down the remaining shares post-IPO. This is because the public market can only support so much supply of shares available for a given issuer at a given time.
Size of Initial Offering. A key assumption in an IPO exit analysis is how much equity you want to sell in the IPO itself (i.e., the first moment shares are sold to the public). Bankers usually size this as a percentage of the total equity value of the business – often ~20% - referred to as the “float” or the amount available for purchase by public shareholders (i.e., the amount “floated” to the public vs. held privately). In reality, like anything else the actual amount will be dictated by market demand for the issuance at the valuation on offer.
Maximum Leverage at IPO. When it comes time to IPO, private equity deals are often too highly levered (i.e., too much debt) to be attractive to public markets investors. Public markets investors will only accept modest amounts of leverage – typically this is around 3.5x Debt / LTM EBITDA or less. Place here an assumption that reflects what you believe is the maximum leverage the current public markets would tolerate for your company.
Initial Price per Share. This is just illustrative – most PE firms start with $10 as a nice round number – but it doesn’t really matter what you pick (will just drive the number of shares created at IPO holding equity value constant).
IPO Discount. Remember, investment banks market IPO shares to new investors at a discount to compensate them for the risk of buying a new / unproven stock – typically in the range of ~10-15%. This is the “Discount at IPO” field in Mosaic. To compute the discounted share price at IPO, multiply the undiscounted initial share price you selected by (1 – the IPO Discount). For example, a $10.00 share sold at a 15% discount would be purchased by IPO investors at $8.50 / share. We recommend setting up two assumptions for discounts – one for the discount at IPO which is typically high (i.e., 10-15%) and one for follow-on offerings post IPO, which typically require a lower discount (e.g., 7-10%).
IPO Underwriter Fees. These fees are paid to the investment banks who market the company ahead of its IPO. An investment bank like Goldman or JPMorgan will fly the private equity firm and management team around the country to meet with large institutional investment managers (e.g., Fidelity, Blackrock, Vanguard) to tell the company’s story and “build a book” of orders for the company’s stock at IPO. They typically get 4-7% of the IPO proceeds as a fee for providing this service. As with the discount, we recommend setting up two assumptions for these fees – one for fees at IPO and one for follow-on offerings post IPO, which are typically lower.
Exit Multiple. The valuation multiple that public market investors will apply to this company when they buy shares sold in the IPO and thereafter (i.e., follow-on share sales).
Trailing vs. Forward. Related to the Exit Multiple – whether the Exit Multiple is applied to the last twelve months (trailing) or next twelve months (forward) amount for the metric selected.
Step 1 – Pre-money Equity Value
The first step to modeling an IPO is setting up a schedule that tracks the business’ running ‘pre-money’ equity value across your relevant investment hold period. You typically wouldn’t have this in a standard LBO, so it should be a new schedule, likely in a separate tab where you’ll build out the full IPO Exit.
Let’s start with some foundational definitions. Skip ahead if you know these:
For these definitions, pretend you’re a private equity firm and you own 100 shares of a company (we’ll call it PortCo) that has 100 shares outstanding (i.e., you own 100%):
Primary share sales. If you created / printed / issued 10 new shares of PortCo that did not exist before and sold them to new investors for $1 per share, it would be considered a ‘primary’ sale. The implications are:
The number of PortCo shares outstanding would increase from 100 to 110.
Your percentage ownership of PortCo would decrease from 100.0% to 90.9% (i.e., 100/110). This is dilution.
PortCo the Company would receive the cash ($10) from the 10 shares sold to the new investors.
You (the PE firm) would not receive any cash.
Secondary share sales. If you sold 10 of the 100 shares you held in PortCo to new investors for $1 per share, it would be considered a ‘secondary’ sale. The implications are
The number of PortCo shares outstanding would not change. Still 100.
Your percentage ownership of PortCo would decrease from 100.0% to 90.0% (i.e., 90/100) because you sold.
PortCo the Company would not receive any cash.
You (the PE firm) would receive the cash ($10) from the 10 shares sold to new investors.
PE firms are big fans of secondary share sales for the last bullet noted above.
Primary share sales introduce a concept not often modeled in private equity (big in venture capital): the distinction between pre- and post-money equity value. These concepts are only relevant in the context of a primary share issuance / equity capital raise. That is because you need to determine (a) how much the company is worth before the capital raise (complex and subjective) and then (b) after the capital raise (simple math once (a) is known).
Pre-money equity value. What is the business’ equity worth before the primary share sale brings more cash into the business? This is an extremely important number for both the existing and the new investors involved in a primary share sale, because it will determine the percentage of the company the new investors get in the primary share sale (and thus the dilution of existing investors).
Post-money equity value. Very simply, the pre-money equity value plus the cash raised in the primary share issuance. Existing company + New investment = Pro forma company.
Onto the table. Here’s what we’re working towards:

We’re getting to equity value the way you would in any model (e.g., in a cap table or sources & uses), but over the whole forecast period instead of just one point in time.
The first row should be the running values of the relevant valuation metric for your business (e.g., Revenue, EBITDA, etc.). A safe place to start is the metric you’re using for your private entry / exit assumption.
In the next row, link the exit multiple you’ve selected for your IPO Exit across the forecast period. Remember, it’s common to assume this multiple will be equal to or even higher than the private exit multiple for the reasons mentioned earlier.
After that, add a TEV line by multiplying the two rows above. Now you have a running forecast of the business’ TEV. Getting close.
All we need now to get to pre-money equity value is our running net debt. Amazing – we probably already have a debt schedule running in our LBO that we can use, right?
Wrong.
The brutal part about modeling an IPO exit in Excel is the need to replicate your levered free cash flow, debt, and tax schedules within the IPO exit analysis. Why? Because typically private equity deals are still too highly levered (i.e., too much debt) when it comes time to IPO (public markets investors will only accept modest amounts of leverage), meaning that we need in most cases to model out a debt paydown transaction at the time of IPO.
We won’t cover modeling those schedules in this article – but you can dive into each here:
Your debt schedules will need to be expanded slightly to include an “IPO Repayment” line within the bridge from beginning to ending balance like so:
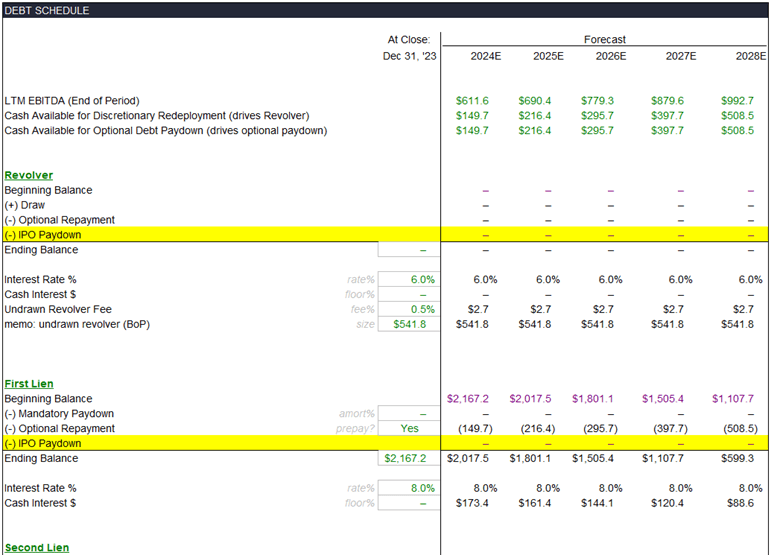
Set them up with zeros for now – we’ll come back to them later.
Step 2 – Required Debt Paydown at IPO
With the free cash flow, debt, and tax schedules in place, we can now compute the company’s leverage at the time of IPO to ensure there isn’t more debt on the company than public market investors would tolerate. Typically this is around 3.5x Debt / LTM EBITDA or less.
Often private equity-backed companies are levered at a higher ratio than this when they are ready to IPO, so we first need to (a) decide what an appropriate max leverage is at IPO – we call this Max IPO Leverage in Mosaic – and (b) calculate what our leverage is at IPO.
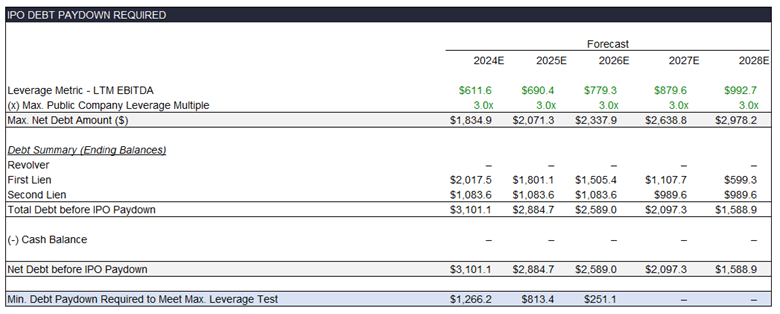
Set up a table that looks like this:
Pre-IPO Total Debt
Set up the top three lines to start – one linking in the relevant leverage metric from your model (e.g., LTM EBITDA in the example above), the next linking in the running max leverage at IPO assumption across each period to clearly show the assumption (3.0x above), and a final row that calculates the implied Maximum Net Debt allowable to hit the max leverage test implied by your assumption (calculate this by multiplying the first two rows together).
We then need to set up a schedule to track the running total debt before we model any repayment related to the IPO transaction. The way to do this is to link each tranche of debt in your debt schedule as shown above, bringing in the beginning balance plus mandatory and optional repayments, but before any IPO-related debt repayments (to avoid double counting). Don’t just link to ending debt in your debt schedule.
Subtract the running cash balance to get the Net Debt balance before any paydown at IPO.
The final line in the schedule that we’ve been working towards is the required debt paydown amount. This is calculated as the Net Debt before IPO Paydown minus the Maximum Net Debt, with a max wrapper around it such that it cannot be negative (i.e., =MAX(calculation, 0))
Now that we know how much debt we would need to pay down, the next step is to model the paydown itself.
If the calculated pre-IPO leverage multiple is higher than the max leverage threshold you’ve deemed appropriate for the business to trade successfully post IPO, you will need to use a portion of the IPO proceeds to pay down debt as part of the IPO transaction. For now, we need to park the debt paydown exercise until we know how much we will be raising at IPO.
Step 3 – Use of IPO Proceeds
While our IPO Exit analysis captures a span of time across many years, the IPO is a point-in-time event – the moment when a company’s shares are first sold to public investors and begin trading on a public exchange (e.g., NYSE, Nasdaq, FTSE, TSX, etc.).
For private equity firms exiting via IPO, it’s also an opportunity to sell primary shares (see definitions above) to new investors and use the cash to pay down debt as necessary to achieve the maximum leverage level they feel is appropriate for the newly public company.
Sizing the IPO
A key assumption in an IPO Exit analysis is how much equity you want to sell in the IPO itself (i.e., the first moment shares are sold to the public). Bankers usually size this as a percentage of the total equity value of the business – often ~20% – referred to as the “float” or the amount available for purchase by public shareholders (i.e., the amount “floated” to the public vs. held privately). In reality, like anything else the actual amount will be dictated by market demand for the issuance at the valuation on offer. We’ll call this “Gross IPO Proceeds” (i.e., before fees).
Underwriter fees are paid to the investment banks who market the company ahead of its IPO. An investment bank like Goldman or JPMorgan will fly the private equity firm and management team around the country to meet with large institutional investment managers (e.g., Fidelity, Blackrock, Vanguard) to tell the company’s story and “build a book” of orders for the company’s stock at IPO. They typically get 4-7% of the IPO proceeds as a fee for providing this service. The Net IPO Proceeds (what the Company actually receives) are simply (1 – Underwriter Fee %) * the Gross IPO Proceeds.
Determining the Primary vs. Secondary Split
Now that we know the total dollar amount of proceeds we’ll receive at the time of IPO, we need to determine how much will be primary vs. secondary. We use the required debt paydown number calculated above to determine this.
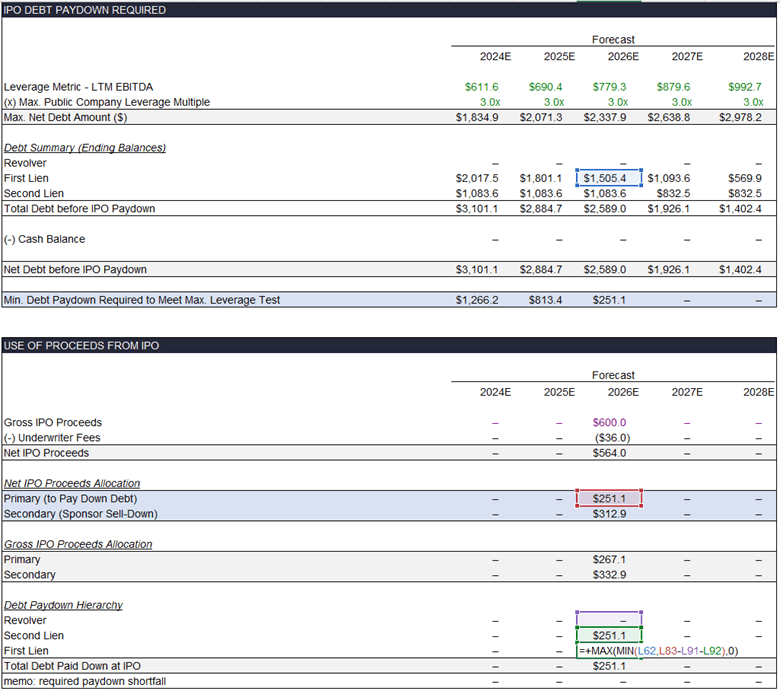
Set up two rows – Primary and Secondary proceeds - as follows:

Set the Primary row equal to:
MAX(MIN(Required Paydown, Net IPO Proceeds), 0)
Set the Secondary row equal to:
Net IPO Proceeds – Net Proceeds Allocated to Primary
This set up uses as much of the net proceeds as available or required for debt paydown, and if there is any left over, allocates it to secondary proceeds.
We now have the amount of cash we can actually use to pay down debt – constrained by the proceeds we raised at IPO. This is important to note – you will not actually achieve the target max leverage at IPO if you don’t raise sufficiently large proceeds at IPO. Double check this manually in Excel or add a color-coded warning (Mosaic presents the user an in-platform warning in these cases).
If the debt paydown requirements at IPO are modest / non-existent (i.e., are less than the Net IPO Proceeds), the remainder will go back to the sponsor as secondary proceeds – i.e., a sale of the sponsor’s shares in the company to first time public market buyers.
Mechanically Implementing the Debt Paydown
Now you have to actually implement the paydown by paying down various tranches of debt to the extent they are drawn. We recommend doing it in the following order, which is how Mosaic does it by default:
Revolver, to the extent there is any drawn
Preferred equity
Senior debt facilities
Junior debt facilities
The rationale for the above ordering is (i) having a materially drawn revolver for long periods of time is frowned upon, but otherwise (ii) if you can pay down more expensive debt, you’d do it ahead of cheaper debt. The latter may not be realistic because of repayment restrictions, but it’s a fine assumption for a deal model, particularly in early stages before your financing package is locked in.
For each tranche, set up the math to pay down lesser of (a) the fully drawn balance of the tranche or (b) the amount of remaining cash you have to pay down debt (factoring in previous tranches’ repayments).
It looks like this:
Step 4 – Share Sell-Down Schedule
Now we need a place to track the good stuff – all the money we make as we sell our (secondary) shares and over time reduce our ownership to zero (i.e., full exit).
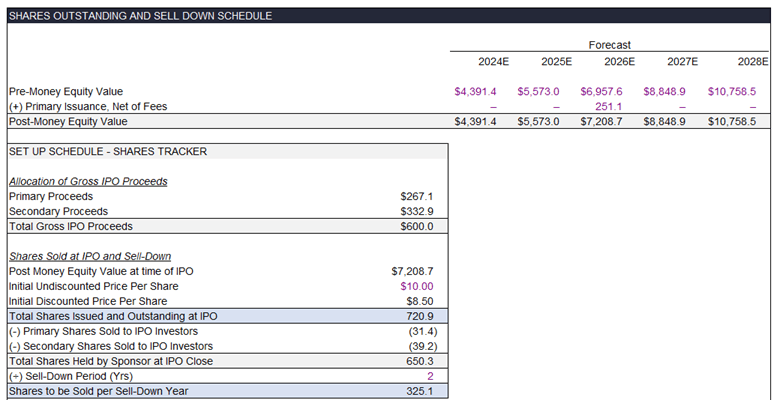
We need a schedule that shows us the total shares outstanding at IPO and that tracks a running total of how many shares we (the private equity firm) own vs. how many shares we’ve sold each period over the hold period. Let’s build it.
Computing the Post-money Equity Value
The Equity Value immediately after the IPO will be the Pre-Money Equity Value computed in the first schedule plus the actual debt paydown at IPO calculated above. Why? Because the IPO Proceeds used to pay down debt would be considered a primary equity issuance – new capital coming into the business, which actually increases the overall equity value (as compared to secondary equity transactions where no proceeds are received by the company).
The next schedule you need to set up looks like this:

Computing Total Shares Outstanding
This is the part that often trips people up late at night. At the IPO date (and for the sell-down period thereafter) we need to set up the total number of shares outstanding for the company so we can keep track of how many we own as the sponsor, how many new shares we create in any primary issuances, and how many of our own shares we sell in any secondary share sales. With that we’ll also be able to imply our ownership % each period and determine when we will finally exit the company fully (i.e., sell our last share).
In order to convert total equity amounts into a number of shares, we need to introduce a price per share concept.
The first step is to pick an illustrative share price for the shares offered to IPO investors before applying an IPO discount. Most PE firms start with $10.00 per share as a nice round number – but it doesn’t really matter what you pick (will just drive the number of shares created at IPO holding equity value constant).
Next, figure out the discounted share price at the IPO. Remember, investment banks market IPO shares to new investors at a discount to compensate them for the risk of buying a new / unproven stock – typically in the range of ~10-15%. This is the “Discount at IPO” field in Mosaic. To compute the discounted share price at IPO, multiply the undiscounted initial share price you selected by (1 – the IPO Discount). For example, a $10.00 share sold at a 15% discount would be purchased by IPO investors at $8.50 / share.
To compute the total shares outstanding at IPO and beyond, divide the Post-Money Equity Value in the IPO year by the undiscounted share price. Carry this number forward for the rest of your forecast (unless you do more primary issuances, which is not common to model). These will be all the shares outstanding for the company – of which your company will own the majority (likely) and the IPO investors will own some post IPO and ultimately all when you sell down fully.
Computing Share Sell-Down
Computing Number of Shares Sold to Primary Investors at IPO
Divide the Gross Primary Proceeds (before fees) by the discounted share price to determine how many shares you sold. Why the discounted price? Because that’s what investors actually paid, which is how you got that pile of Gross Primary Proceeds. Subtract this number from the Total Shares Outstanding number to arrive at a “Beginning Balance” of shares held by the private equity firm immediately post IPO and use this beginning balance as a running line to track shares held for the rest of the sell-down period.
Computing Number of Shares Sold to Secondary Investors at IPO
Next, if any exist, divide the Gross Secondary Proceeds (before fees) again by the discounted share price to determine how many shares you sold at the time of IPO.
Computing Number of Shares to Sell Per Period Post IPO
Now that you know how many total shares there are, how many you sold during the IPO (through some combination of primary and secondary sales), you know how many you as the sponsor are left holding.
Take the total amount of shares you have remaining and divide this number by the sell-down period you have selected. The result is the number of shares you need to sell per period after the IPO.
This is a lot – but try using the example below and recalculating it yourself to internalize the concepts.
Computing Post IPO Sell-Downs
For each period’s sell-downs, recompute the undiscounted share price as the pro forma equity value calculated above divided by the total shares outstanding (doesn’t change from the IPO).
Then, once again calculate the discounted share price by dividing the undiscounted share price by (1 + the IPO Discount: Secondary) – we use the secondary discount rate for shares sold post IPO, which is typically lower than the initial IPO discount because these follow-on sales are viewed by investors as lower risk than the IPO shares.
Finally – build a roll-forward schedule of shares held by the sponsor that tracks the subsequent share sell-downs through to final exit, presenting the sponsor ownership % as a memo line. Recall we calculated the Secondary Sell-Down Shares Post IPO above by dividing the shares remaining at IPO by the Sell-Down Period.

Step 5 – Net Sponsor Proceeds Schedule
Now that we have a schedule showing the number of shares sold by the sponsor each period, as well as the discounted price per share for each period, we can compute the cash collected by the sponsor in each period.
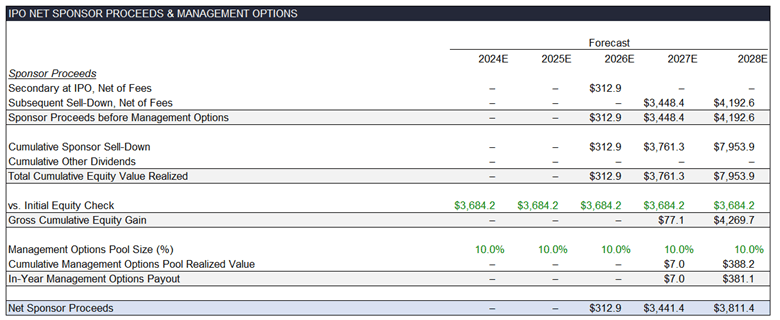
Computing Sponsor Proceeds before Management Options
Set up a schedule like the below to separately track what the sponsor sold at IPO vs. the sell-down period thereafter and add them up into one line called “Sponsor Proceeds before Management Options.” Remember to apply the Underwriter Fees at this point, i.e., the first two lines of the schedule below are calculated as (Discounted Share Price * Number of Shares Sold * (1 – Underwriter Fee)). Remember to apply the Underwriter Fee – Initial to secondary proceeds received at IPO, and the Underwriter Fee – Secondary to proceeds received thereafter.

Computing Management Options
Next, we need to calculate how much of the modeled gain needs to be shared with the management team per the options pool you’ve set in place. Unlike the private exit scenario where the management team receives a payout all at exit, in a situation where the exit is realized over several sell-downs, the management team may also receive payment over multiple years.
The premise is that they will receive payout as soon as the sponsor has taken out more than 1x their original investment and will continue to receive payments as further equity is sold.
Track the Cumulative Equity Value Realized by the sponsor as the sum of the Sponsor Proceeds before Management Options calculated above plus any other dividends paid out over the investment period. Make this line cumulative by adding the previous year’s total to the current year’s calculated amounts.
Compare this Cumulative Equity Value Realized line to the Initial Equity Check to get the Gross Cumulative Equity Gain.
Apply the Management Options calculation to this Cumulative Equity Gain (i.e., multiply it by Pool Size % / (Pool Size % + 100) to appropriately factor in dilution) to get the Cumulative Management Options Pool Realized Value.
Translate this to an in-year payout by subtracting the previous year’s balance from the current year’s balance. This is how much cash the management team will receive each period.
Subtract from the Sponsor Proceeds before Management Options the In-Year Management Options Payout as shown below to get the Net Sponsor Proceeds.
Step 6 – Exit & Returns Schedule
Finally, we have all the ingredients to pull together the schedule we showed at the beginning of the article.
Lay out in a schedule the Entry Equity Check, followed by any additional equity injections from the sponsor, followed by the gross sell-down we computed above. Next, bring in the in-year management options payout to get to the Net Sponsor Equity Cash Flows.
IRR is computed as the XIRR of the Net Sponsor Equity Cash Flows line as well as the 12/31 dates for each year of the investment period.
The MOIC is calculated as:
A. The sum of the Gross Sponsor Sell-down plus any additional dividends received minus the management options payout; divided by
B. The sum of the initial entry equity check plus any additional equity contributed over the investment period.

If you’re still spending time reinventing this kind of analysis outside of Mosaic – and would like to spend Less Time Linking, More Time Thinking™ – please contact sales@mosaic.pe and start working smarter today.
Request a Demo
Reach out to learn how investment professionals across the globe are leveraging Mosaic to work more efficiently.
Our team will get back to you within one business day.